I was never really happy with the way I taught the concept of functions. My kids could identify functions and use the vertical line test, but I felt like they were missing the big picture about each input having a single output. If I had asked my students why we use a vertical line, rather than a horizontal line, to determine whether a graph is a function, I doubt many of them could have answered.
So I decided to restructure the way I teach functions. Last year, I did a big unit on linear functions and then went to functions more generally. This year I switched those topics. I started with looking at functions in all sorts of different ways and then moved into linear functions.
So far, this switch has been seriously paying off. My students have a better understanding of the meaning of a function, and I have laid the groundwork for some great upcoming work with slope and linear functions.
Here are the standards I am trying to teach:
“CCSS.MATH.CONTENT.8.F.A.1
Understand that a function is a rule that assigns to each input exactly one output. The graph of a function is the set of ordered pairs consisting of an input and the corresponding output.
CCSS.MATH.CONTENT.8.F.B.5
Describe qualitatively the functional relationship between two quantities by analyzing a graph (e.g., where the function is increasing or decreasing, linear or nonlinear). Sketch a graph that exhibits the qualitative features of a function that has been described verbally.”
Below is an outline of what I did over the past couple of weeks, along with notes on what I'd change next time.
Warning: This is not a blog post about a finished product with crisp, clean packaging. I threw together this sequence of lessons haphazardly and will change it a great deal next year. But I think the bones of this sequence are beneficial and worth sharing.
Before the Unit
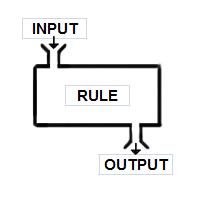
About a week before my functions unit was set to start, I started doing "Guess My Rule" warm-ups. First I drew the following picture on the board.
I told my students "I am thinking of a mathematical rule. I will ask a random student for a number, which I will drop in this machine. I will do some mental math and tell you the output of the machine. After I do this three times, I want you to guess my rule."
My first rule, "add 6" was pretty easy, but my second rule, "double and add 4" was hard for students to follow, so they asked me to write the answers on the board. This generated a need for a table of values, which I was happy to provide.
I played this game with students a few times each day for three days. Here are some of my rules:
3x
x^2 - x
180 - x
Round x to the nearest 10 (this one is really important, as you'll see later)
Divide x by 5: the output is the remainder
Whenever possible, I ask students to describe the rule in words and as an expression, so they are used to writing expressions for functions. But I still haven't used the word "function." For now, I just call it a mathematical rule.
The Functions Unit
Day 1: Function Carnival

On the first day of the unit, I used Function Carnival from Desmos. I love this activity because it is so responsive to kids' exploratory inputs. Also, kids really want to get that "Really Precise" designation, so they learn how to pause the time and find the exact height of Cannon Man at every point!
As with all Desmos activities, I find that the best setup is to pair students up with a single computer and only let one person touch the computer at a time. I have the kids switch every few minutes, and that way they are communicating a lot with their partner about how to improve their graphs.
By the end of class, I am sure to find a student who has scribbled all over their graph and play that animation for the whole class. I want students to notice how many cannon men there are at one time! This will pay off in future lessons.
Day 2: Interpreting Distance-Time Graphs
On Day 2 I use my absolute favorite activity of the whole year: Interpreting Distance-Time Graphs by the Shell Centre.
In this activity, students are supposed to match ten stories with distance-time graphs. I give each pair of students an envelope with the ten graphs and ten stories and ask them to get started matching! Meanwhile, I circulate and see if I need to speak with any students who are particularly struggling.
When a pair of students has matched all ten of their stories and graphs, I come by to check. I only tell them how many are matched correctly; I don't tell them which ones are correct. I almost never have students who get all ten matches correct on their first try. Most students need two or three drafts to get the answers all correct. After all, there are some tough problems!
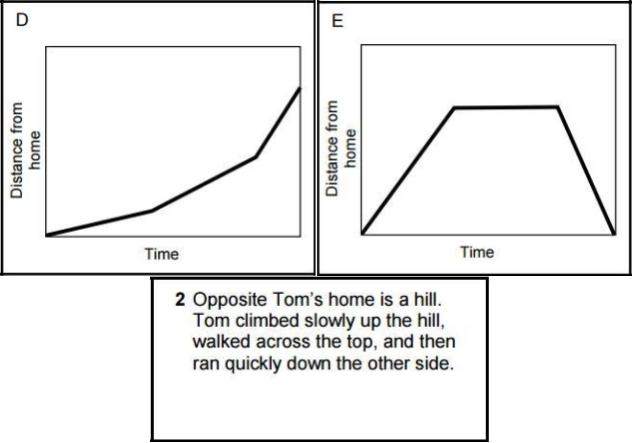
Which graph shows Tom's distance from home? Which graph do most students choose at first?
After every group of students has done at least one draft of their answers, I call on students to match and justify one story and graph. I have big magnetized versions of each story and graph, so kids just go up to the board and shift the magnets around on the white board. I like this portion of the lesson because kids have some agency over which story to match, but everyone knows they could be called on to explain their choices.
As kids were discussing their justifications, I noticed that a lot of kids had intuitive thoughts about the way that slope represented speed in the stories. Kids would say things like "It's going up fast here so he is running" or "He's not moving because it's flat here." As we discussed, I realized that I could tap into these intuitions when we finally start to formalize slope. For now, we use lots of terms to describe this aspect of the graphs. Slope, steepness, closer to vertical. Right now I'm just focused on getting kids to read the graphs from left to right and notice how the output changes.
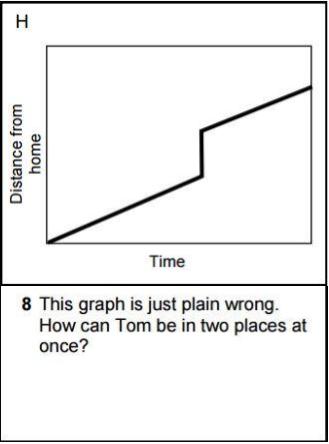
We spent a lot of time discussing the graph/story pair at left. I really wanted to hammer home the idea that this graph somehow broke a rule that every other graph was following. I didn't use the phrases "function" or "vertical line test," but I did get students to explain to each other and to me why this graph was just plain wrong. We even talked about what it would've looked like as a Cannon Man animation! Just like on day 1, I was planting the seeds of functions/non-functions and waiting for them to blossom.
In the future I'd like to give an exit slip where I get every student to write down their explanation for a specific story/graph combination. This year I ran out of time.
Day 3 - Matching Tables to Distance-Time Graphs
On Day 3, we finished the Shell Centre activity. I had never done this part of the activity before, and I was amazed at the connections my students were making.
As a warm-up, I asked the students to match all the stories and graphs once more. Then I came around with a set of nine tables of values and asked students to match each table of values to a graph. Once again, I circulated and told students how many they had gotten correct (but not which ones!). As I circulated, I began to notice that students were using slope-related ideas to match the tables and graphs! Listening to kids debate the tables and graph below, I heard kids saying things like "the line is steep so that means he is moving fast, but the numbers in the table aren't moving as fast." It made me very excited to get into slope in the future.

How would you decide which table belongs with Graph E?
Just like Day 2, I then called on random students and asked them to justify a matched pair of table and graph. Once again, we talked about this impossible graph and how the table matched it. Once again, laying groundwork for a future discussion of functions.
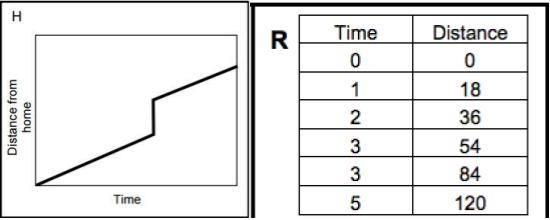
Why does Table R match with Graph H?
Day 4
Day 4 I did an activity I created that went poorly, so I'd change this next year. Perhaps I'd have students do the brand new Desmos Graphing Stories activity. The reason this is a good option is that we've spent two days looking at distance-time graphs, and I don't want kids to believe that distance and time are the only variables we can graph on a coordinate plane! The Graphing Stories activity has height, number of eggs in carton (which makes a nice step function), distance from camera, and so on. I can't wait to try it with my students next year.
As an extension of the Graphing Stories activity, we could brainstorm some other ideas for x and y axes, then have students graph their own! This might be a way to get kids thinking more about independent and dependent variables. My students often struggle to think of variables as quantities, so perhaps by embedding them in graphs first we can think about how variables must be quantified.
I'm still puzzling over what exactly to do here. Maybe I need another day here to explicitly introduce independent and dependent variables. But that's not what I did this year. I just moved blithely along! At least there's always next year.
Day 5
On this day, I make a hard shift from graphs and go back to my function machines. We play three more rounds of "Guess my Rule" as a warm-up, and then I define what is a function.
Importantly, I mention over and over that a function is a relation where every input has exactly one output. Then the first dozen or so examples we talk about in class are qualitative, not mathematical. I find that kids understand the distinction better when we start outside of "math world" for a while.
My first examples are below:

I try to emphasize that both examples are rules. They both pair inputs with outputs. The difference is that the second rule could have many different outputs for a single birthday, whereas the first example should pull up the same person every single time you put in a SSN.
I then have kids come up with their own examples: three functions and three non-functions. Then they share with their tablemates. I circulate and pick out several interesting examples, and I call on kids to share and justify their answers.
At the very end of class, I ask kids if they can come up with a mathematical rule that is a function, and one that is not a function. Kids really struggle with that second part, but that's okay because we are about to get to...
Day 6
This is the day when it all came together for my students.
We start the day playing "Guess my Rule" again. The first two rules, x^2 + 1 and "round to the nearest 10," were greatest hits from the previous week, so kids got them quickly.
But my third rule is y < x, which gets really tricky for kids. It gets especially tricky because I deliberately choose numbers to confuse kids. So let's play through the first three numbers that are guessed:
A kid says "13" and I say "11"
Another kid says "7 and I say "5"
A third kid says "10" and I say "2"
Now they are really confused. I ask if they want a fourth number. They do.
Another kid guesses "5" and I say " -437"
WHAT??? What is going on? There is bedlam in the classroom. A kid says "There's no rule!" and I say "There is a rule. I am doing mental math."
We do another couple of numbers. A kids says "14" and I say "10". Another kid says "6" and I say " -7654"
They INSIST that there is no rule, and I INSIST that there is. Then some kid says it. "It's not a function." Bingo. Say that again for everyone.
"It's not a function."
How can you check to make sure?
"Put in the same input and see if we get a different output"
So whatever number was last asked, the students ask again.
They say "6" and I say "5." Then they say "6" and I say "-31." Then they say "6" and I say "0."
We've figured it out. It's not a function. But we still don't know the rule. Either by prodding or hinting, I get them to realize that all the outputs are less than the inputs. That's the rule. y < x.
So now, just in the warm-up, we have had a visceral experience of what it feels like when the same input gives you different outputs. We know that's not a function, and we know why.

Once we finished the warm-up (which was really a full lesson in disguise) we started looking at other ways that functions present themselves. First, we looked at some familiar graphs. My students were able to describe why the second graph was not a function. I even had kids say things like "If you draw a line straight up the middle, it goes through the graph two times." I made sure to ask them why the horizontal line was acceptable, but the vertical line wasn't.

Then we looked at a pair of familiar tables. Again, I made sure to ask students why a repeated output was acceptable but a repeated input was problematic. We even tied this back to the warm-up rule about rounding to 10. There are lots of numbers that round to 20, but they always round to 20.
The Rest of the Unit
The rest of the unit, I used the same stuff I've done in the past. We worked on a functions card sort and an independent/dependent variable card sort, both of which I adapted from Sarah at Math Equals Love. We drew graphs to match stories and wrote stories to match graphs. We took a quiz that went well! I was pretty pleased with how it all turned out.
Mostly, I loved the feeling of coherence that I got in my first six days of the unit. To the students, it probably felt like a wide variety of different activities, but they were all devoted to getting kids to read and interpret functions in a variety of different contexts and representations. It was the type of lesson planning that I've been aspiring to for the past seven years, and this felt like one of my most successful lesson sequences of my career.
As I said earlier, this sequence has continued to pay off as I've delved into slope and linear functions, but that will have to wait for another post...
While you wait, help me brainstorm! What should I do for Day 4 next year? What important topics am I missing, or feel undercooked in this lesson sequence? I'd love to hear your feedback.